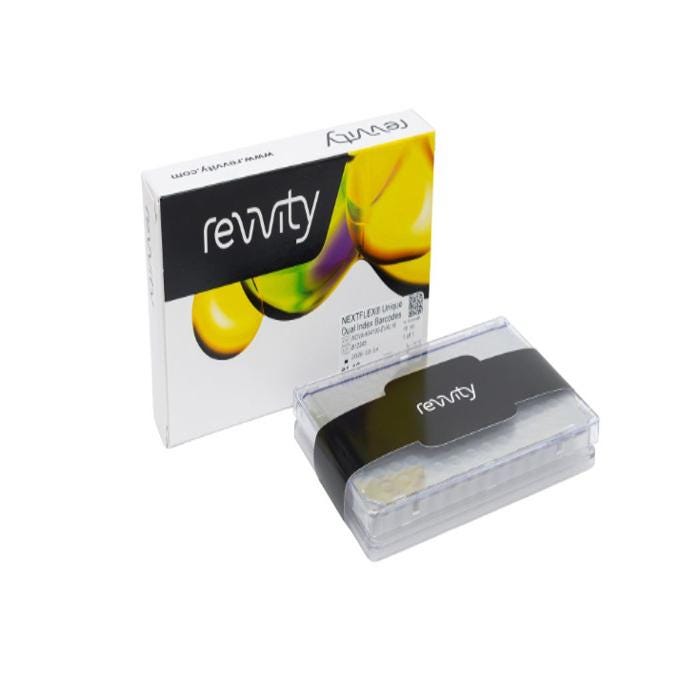


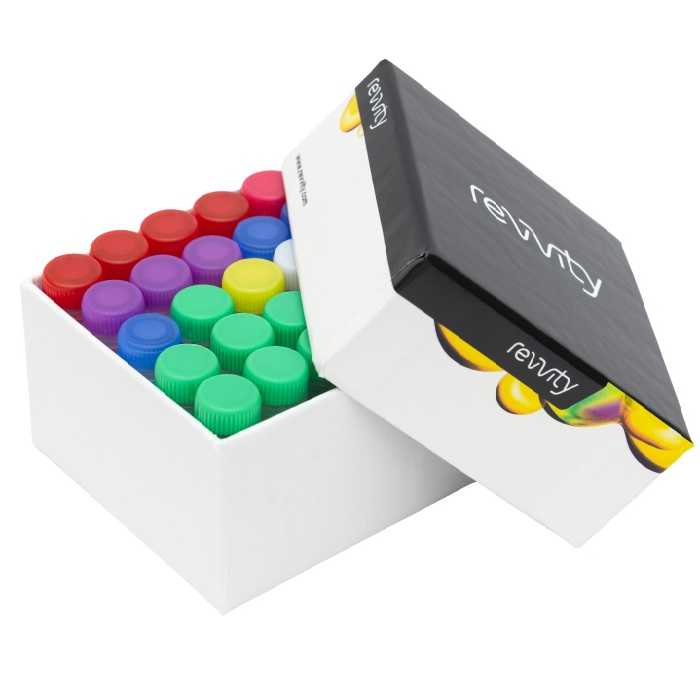

<p>NEXTFLEX™ Rapid XP V2 DNA-Seq Kitは断片化ベースの全ゲノムシーケンシング(WGS)ライブラリー調製ワークフローで、最短2.5時間でDNAからシーケンス用ライブラリーを調製できます。NEXTFLEX独自のノーマライゼーションビーズが、ライブラリー濃度をライブラリー調製プロセス中に均一化するため、別途の定量化や手動プーリングが不要です。</p>
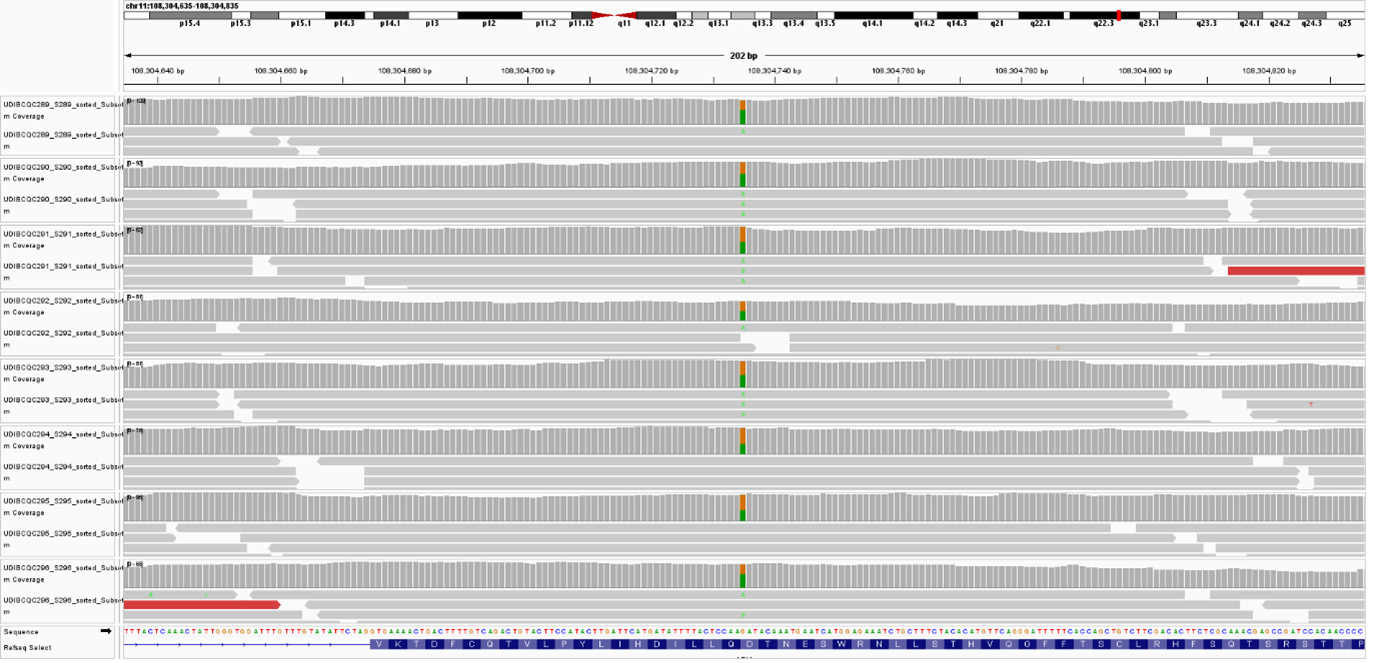
<p>このプロトコルは、100 pgから1 µgのサンプルに対応し、250 ng以上に対応するPCR-freeオプションを提供してライブラリーの複雑性を保ち、GCバイアスを最小限に抑えます。結果的に得られるライブラリーは、Illumina®およびElement Biosciences™ AVITIプラットフォーム上で均一なカバレッジと低い重複率を示し、全ゲノム、メタゲノム、およびその他の研究用途での確実なバリアント検出を可能にします。</p>
<p>自動化対応の試薬、高いインデックス能力(最大1,536 UDI)、合理化されたクリーンアップにより、あらゆる規模で迅速で再現性のあるDNA-seqの結果を提供します。</p>
- シングルチューブ酵素断片化、エンドリペア&Aテーリング - 最短2.5時間でDNAをシーケンシング対応ライブラリーへ
- 250 ng以上のサンプルに対応するPCR-freeオプションおよび100 pg - 1 µgの広範囲なサンプル濃度に対応したPCR増幅
- NEXTFLEXのノーマライゼーションビーズ - ライブラリー後の定量化や手動プーリングを省略可能
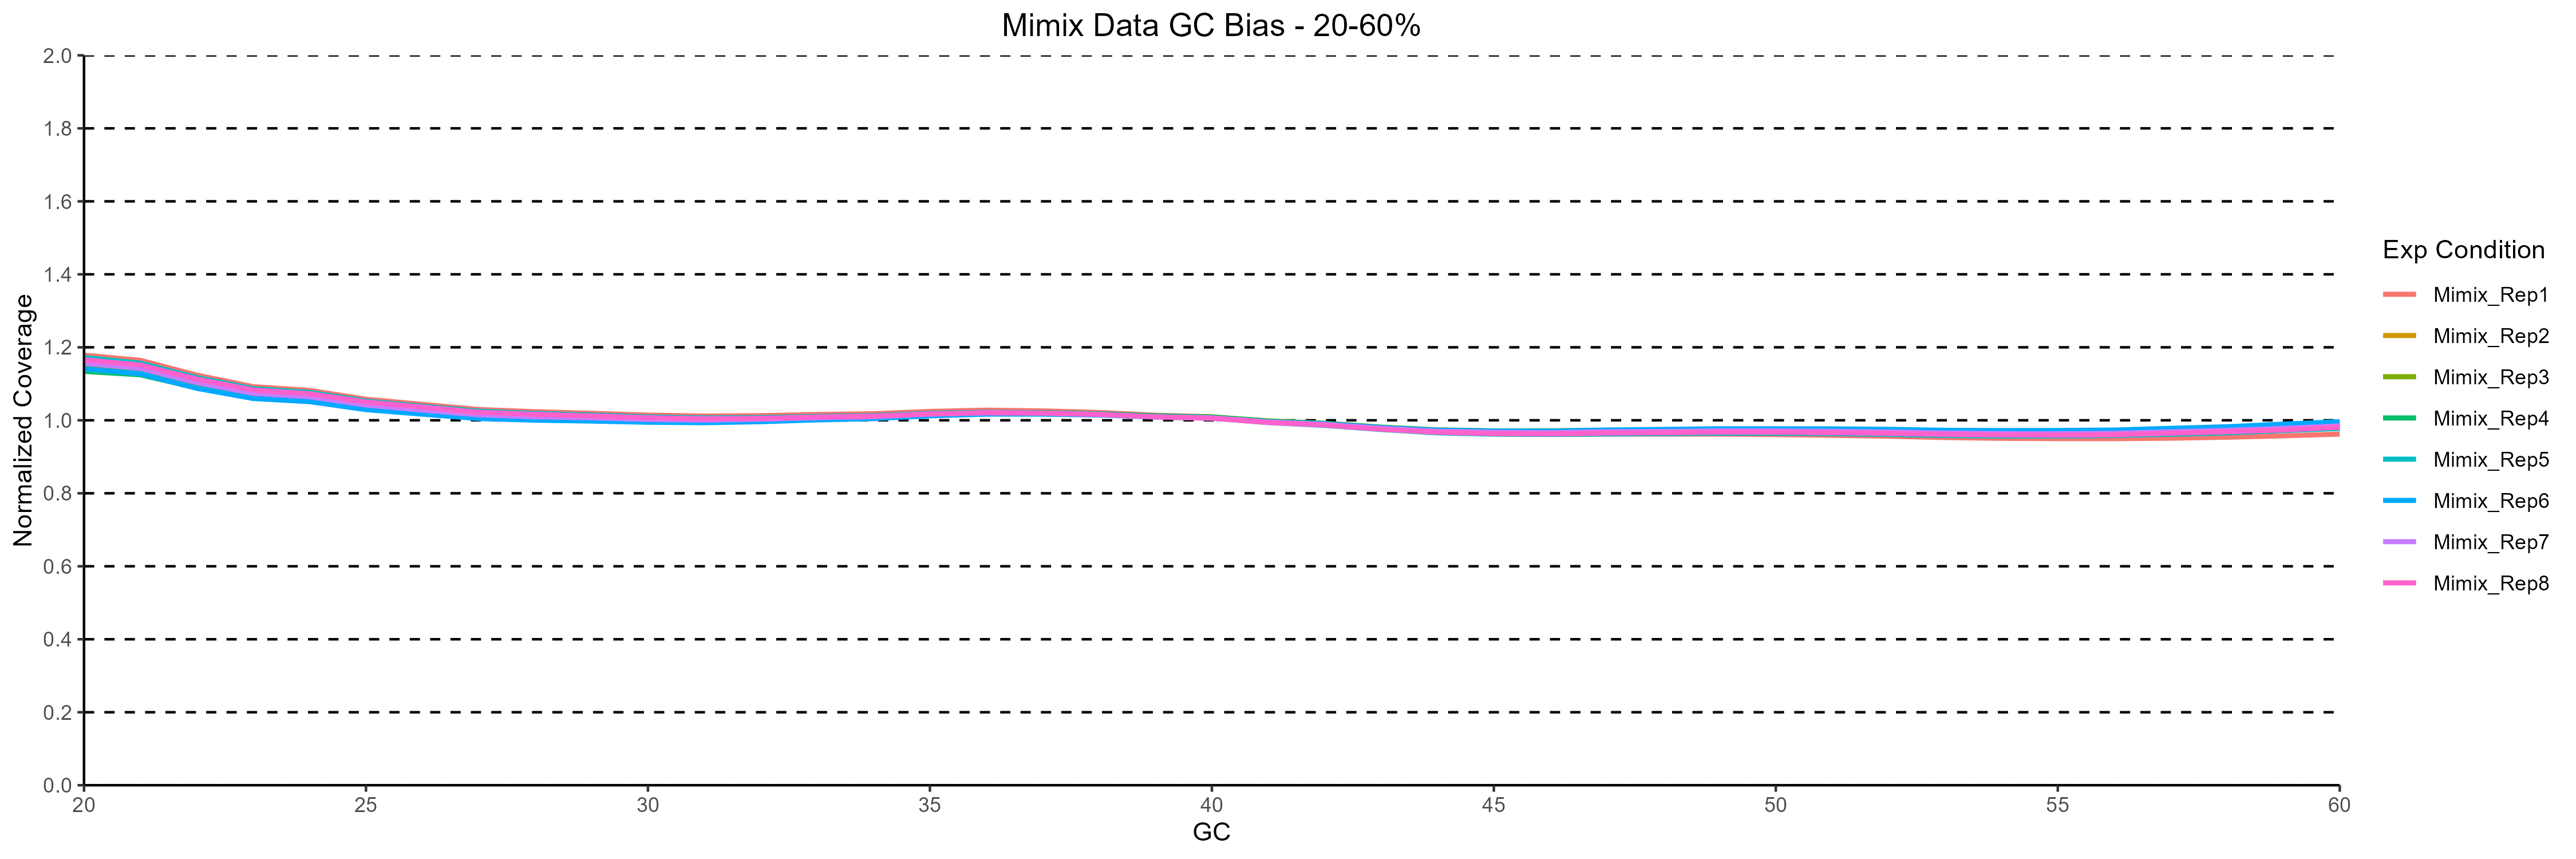
- 低濃度のアダプターダイマーの形成、および均一なGCカバレッジで確実なバリアント検出
- 大規模な多重化研究に対応する最大1,536 UDI利用可能
- 96 UDI-UMIバーコードセットにより、希少バリアント検出の分子誤差補正が可能
- Revvity Automation NGSワークステーションで検証済みの自動化対応ワークフロー
- 各ロットを徹底的にテストすることで品質を保証しています。
NEXTFLEX Rapid XP V2 DNA-Seq Kit は、速度、データ品質、スケーラビリティを融合しています。酵素断片化によりワークフローが合理化され、独自のノーマライゼーションビーズがQCステップ全体を省略し、オプションのPCRフリー経路がライブラリーの複雑性を保ちます。サンプルを少量処理する場合でも、自動分注機上で96ウェルプレートを処理する場合でも、Illumina®およびElement AVITI™シーケンシングに対応した一貫性のある偏りのないライブラリーを作成します。