


Introduction to semen analysis
Using the Cellometer Vision*, a fluorescent-based cell counter, it was possible to image and perform cell concentration and viability analysis on multiple semen samples. The live semen samples were stained with SYBR 14 while the dead semen were stained with propidium iodide (PI). This strategy was used to measure the concentration and viability of semen across a wide range of species: bear, goat, human, sea urchin, dog, honey bee, donkey and mouse.
*The Cellometer Vision instrument has been superseded by the Cellometer Spectrum.
Goat semen concentration and viability using the Cellometer Vision
Method
- Obtain goat semen sample
- Dilute sperm using PBS
- Prepare a dilution of the SYBR 14 (Molecular Probe) stock solution in PBS
- Add SYBR 14 to the sperm sample and incubate
- Add PI (Revvity, Cat# CS1-0109) to the same SYBR 14-stained sperm sample and incubate
- Remove from the incubator and pipette 20 µL of stained sperm sample into the Cellometer counting chamber
- Wait for the sample to settle and insert counting chamber into the Cellometer Vision
Results for goat semen assay
Brightfield image & combined counted F1/F2 image
Goat semen imaged in the Brightfield channel (left). Combined counted F1 (Green – SYBR 14) and F2 (Red – PI) images (right). The cells that are outlined in green are the live nucleated cells counted. The cells that are outlined in red are the dead nucleated cells counted.
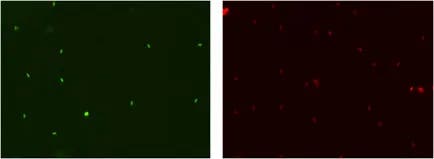
SYBR 14 stained live cells & PI stained dead cells
Goat semen imaged in the Brightfield channel (left). Combined counted F1 (Green – SYBR 14) and F2 (Red – PI) images (right). The cells that are outlined in green are the live nucleated cells counted. The cells that are outlined in red are the dead nucleated cells counted.
Results table
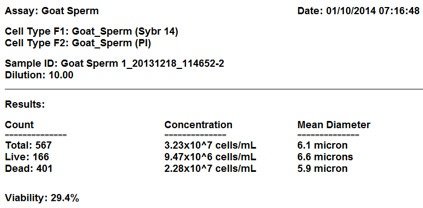
The Cellometer results table showing total cell count, live and dead counts, concentrations and mean diameter. It also features the percentage of cell viability.
Conclusion
Cellometer Vision was successfully used to measure concentration and viability of goat sperm using SYBR 14 and PI.


For research use only. Not for use in diagnostic procedures.