


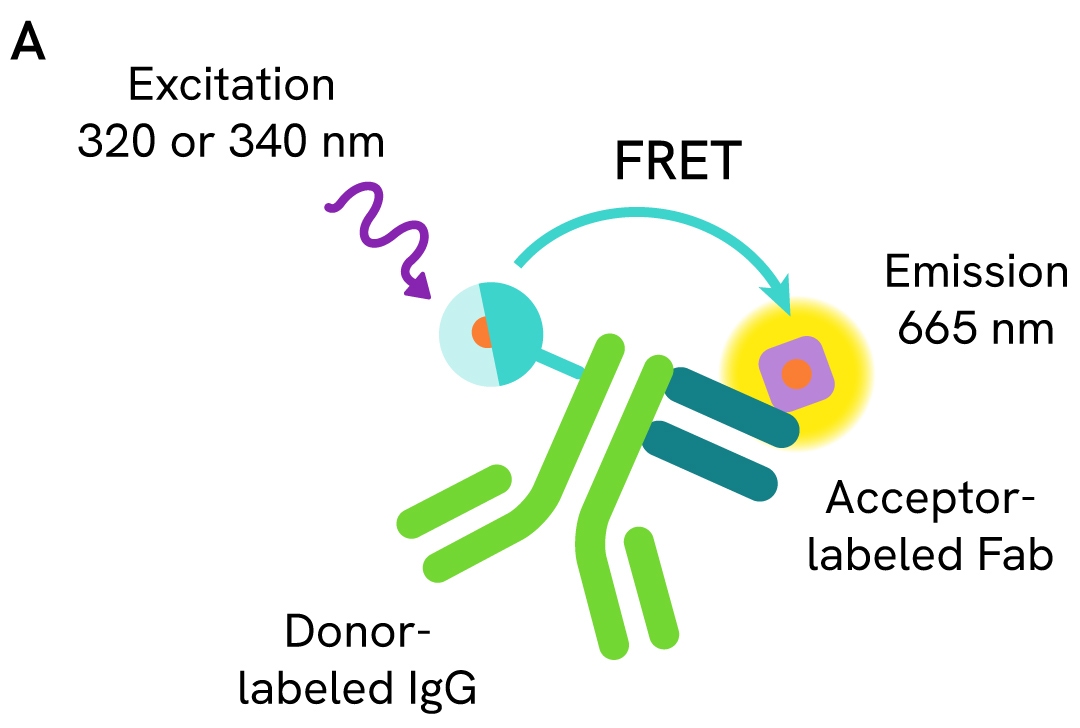
The affinity of the various pHSense™ Fab anti-IgG reagents was evaluated using a traditional HTRF assay setting (Figure 1). The affinities determined for the different Fab reagents are described in the following figures and tables.
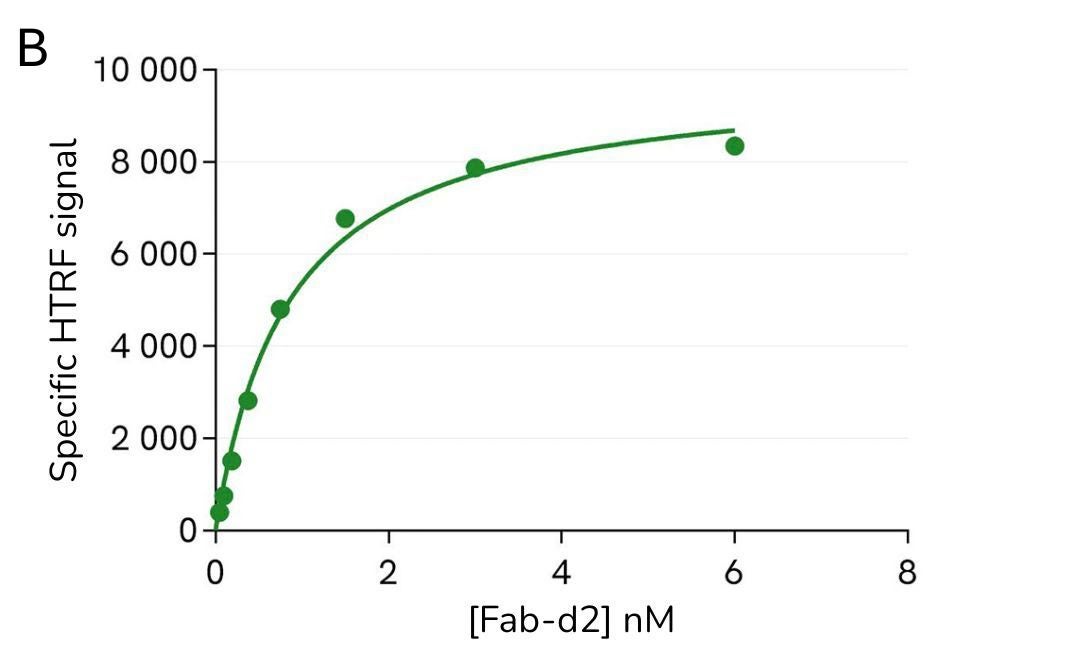
Figure 1: HTRF saturation binding assay designed to assess the affinity of Fab fragments towards various IgG isotypes
A. HTRF Assay Setting. To evaluate the binding affinity between the Fab anti-IgG agent and different IgG isotypes, a donor-labeled IgG was incubated at a fixed concentration with increasing concentrations of d2-acceptor dye labeled Fab-anti-IgG. The signal at 665 nm is indicative of the level of interaction between the d2-Fab and the Donor-IgG and the HTRF ratio (665 nm/620 nm X 10,000) was calculated. B. Typical saturation binding curve used to determine the value of the Kd.
|
High affinity for Human IgG isotypes in DMEM cell culture medium. |
|
|---|---|
| Human IgG isotype | Measured Kd |
| IgG1 | 0.99 nM |
| IgG2 | 5.34 nM |
| IgG3 | 6.77 nM |
| IgG4 | 3.36 nM |
|
High affinity across various pH conditions. |
|
|---|---|
| PO4 buffer pH | Measured Kd |
| 5.19 | 2.18 nM |
| 6.14 | 3.22 nM |
| 6.87 | 2.09 nM |
| 7.41 | 2.81 nM |
Table 1: pHSense Eu Fab anti-human IgG affinities (81HUEU1AA, 81HUEU1AB, 81HUEU1AC)
C
| Mouse IgG isotype | Measured Kd (T=2h) in DMEM |
|---|---|
| IgG1 | 0.13 nM |
| IgG2a | - |
| IgG2b | - |
| IgG2c | - |
| IgG3 | 25.8 nM |
D
| PO4 buffer pH | Measured Kd (T=2h) |
|---|---|
| 5.2 | 0.32 nM |
| 5.9 | 0.34 nM |
| 6.7 | 0.35 nM |
| 7.4 | 0.49 nM |
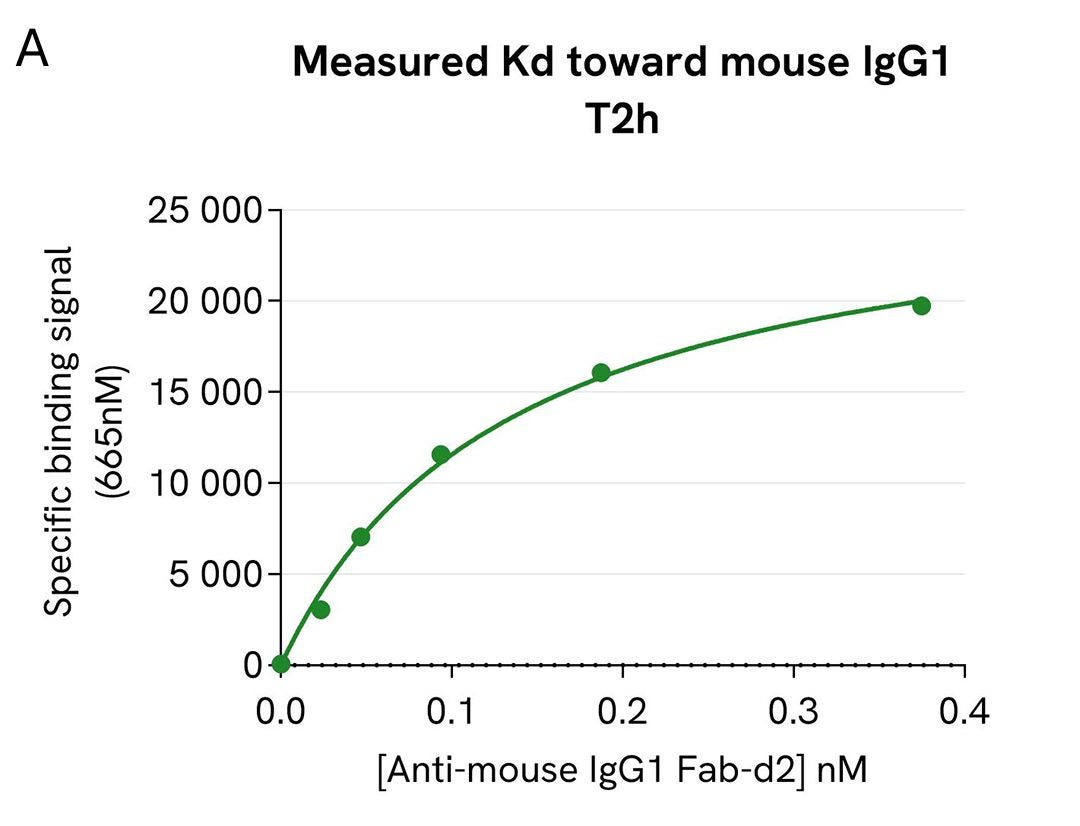
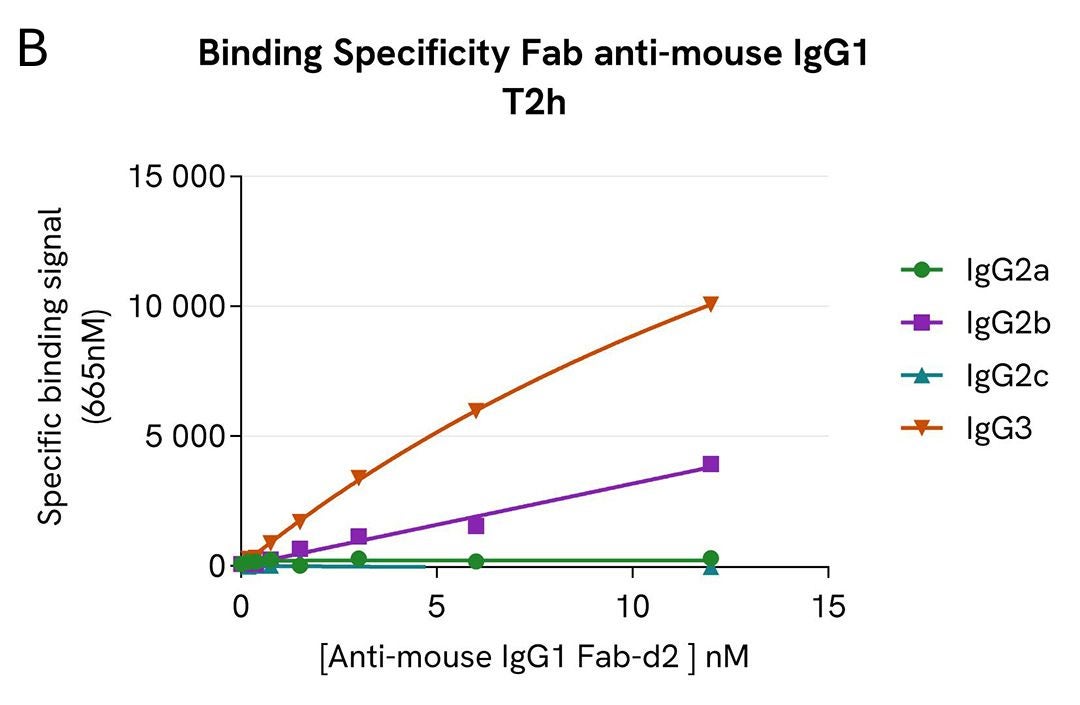
Figure 2: pHSense Eu Fab anti-mouse IgG1 affinities (81MO1EU1AA, 81MO1EU1AB, 81MO1EU1AC)
A. Saturation binding curve on mouse IgG1. B. Saturation binding curve on mouse IgG2-3 showing low cross reactivity detected with mouse IgG2b and IgG3. C. Summary table showing high affinity for Mouse IgG1 Isotypes in DMEM Cell Culture Medium (without FBS) D. Summary table showing independency of binding regarding various pH conditions in phosphate buffers.
| Mouse IgG2 isotype | Measured Kd |
|---|---|
| IgG2a | 0.95 nM |
| IgG2b | 0.31 nM |
| IgG2c | 0.71 nM |
Table 2: pHSense Eu Fab anti-mouse IgG2 affinities (81MO2EU1AA, 81MO2EU1AB, 81MO2EU1AC)
High affinity for Mouse IgG2 Isotypes in DMEM Cell Culture Medium
A
| IgG species | Measured Kd |
|---|---|
| Rabbit IgG | 0.57 nM |
| Human IgG1 | - |
| Mouse IgG1 | - |
| Mouse IgG2a | - |
C
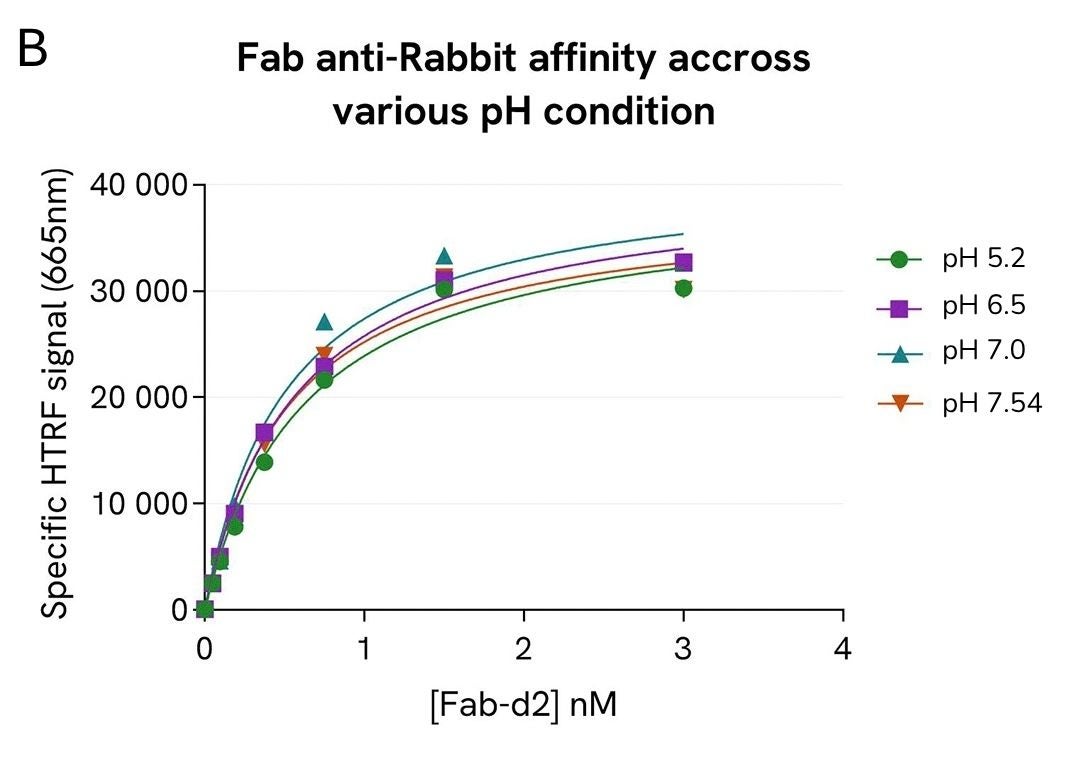
| PO4 buffer pH | Measured Kd |
|---|---|
| 5.2 | 0.63 nM |
| 6.5 | 0.57 nM |
| 7.0 | 0.51 nM |
| 7.54 | 0.52 nM |
Figure 3: pHSense Eu Fab anti-rabbit IgG affinities (81PAREU1AA, 81PAREU1AB, 81PAREU1AC)
A. Summary table showing high affinity and specificity for Rabbit IgG in DMEM Cell Culture Medium (without FBS) B. Saturation binding curves at different pH conditions in phosphate buffers. C. Summary table showing independency of binding regarding various pH conditions in phosphate buffers.
For research use only. Not for use in diagnostic procedures.
The information provided above is solely for informational and research purposes only. Revvity assumes no liability or responsibility for any injuries, losses, or damages resulting from the use or misuse of the provided information, and Revvity assumes no liability for any outcomes resulting from the use or misuse of any recommendations. The information is provided on an "as is" basis without warranties of any kind. Users are responsible for determining the suitability of any recommendations for the user's particular research. Any recommendations provided by Revvity should not be considered a substitute for a user's own professional judgment.
