


Introduction
The Cellometer image cytometers are capable of performing automated concentration and viability measurement using both Trypan blue and fluorescent methods. The fluorescent Cellometer instruments
 Cellometer Ascend Automated Cell Counter
, such as Auto 2000, K2 and Ascend, determine viability by counting cells stained with acridine orange (AO) and propidium iodide (PI). This allows for more reliable detection of nucleated cell in samples such as PBMCs and splenocytes that contain red blood cell contamination. The Cellometer Auto 2000 has been validated for reliability, reproducibility and linearity against manual counting using a hemocytometer following the recommended testing guidelines set by NIST (National Institute of Standards and Technology).
Cellometer Ascend Automated Cell Counter
, such as Auto 2000, K2 and Ascend, determine viability by counting cells stained with acridine orange (AO) and propidium iodide (PI). This allows for more reliable detection of nucleated cell in samples such as PBMCs and splenocytes that contain red blood cell contamination. The Cellometer Auto 2000 has been validated for reliability, reproducibility and linearity against manual counting using a hemocytometer following the recommended testing guidelines set by NIST (National Institute of Standards and Technology).
Cellometer Auto 2000 reliability and precision
Reliability of the Cellometer Auto 2000 counting method was determined by comparing the calculated % CV of two individuals. (Hemocytometer and Auto 2000). The precision of the Cellometer Auto 2000 counting method was determined by comparing the calculated % CV intra (single) user (Auto 2000). The reliability and precision tests used 5 µm diameter beads at a concentration of 1.0 x 10⁶ beads/mL. Two users performed 6 counts each of the beads with a hemocytometer and 12 counts each of the beads on the Cellometer Auto 2000 under same conditions. The results obtained from the Cellometer Auto 2000 were compared with the results from the hemocytometer. Coefficients of variation (%CV) between each counting method and between users were calculated. The % CV was 2.9% for the reliability of the Cellometer Auto 2000 with the hemocytometer and between two users. Precision of the Cellometer Auto 2000 was 4.6% and 3.5% for % CV intra user 1 and user 2 respectfully and an % CV inter user 1 & 2 of 1.8%
| Hemocytometer | Bead Concentration (x106beads/mL) | % CV intra |
|---|---|---|
| User 1 average (n=6) | 1.05 | 4.9% |
| User 2 average (n=6) | 1.11 | 6.9% |
| User 1 & 2 average (n=12) | 1.08 | |
| STDEV User 1 & 2 | 0.043 | |
| %CV inter Uswer 1 & 2 | 4.0% |
| Hemocytometer | Bead Concentraion (x106beads/mL) | % CV intra |
|---|---|---|
| Auto 2000 | Bead Concentration (x106beads/mL) | % CV intra |
| User 1 average (n=12) | 1.01 | 4.6% |
| User 2 average (n=12) | 1.04 | 3.5% |
| User 1 & 2 average (n=24) | 1.03 | |
| STDEV User 1 & 2 | 0.019 | |
| %CV inter User 1 & 2 | 1.8% | |
| Hemocytometer & Auto 2000 | Bead Concentration x106beads/mL) | %CV intra |
| User 1 average (Hem & A2K) | 1.03 | 2.4% |
| User 2 average (Hem & A2K) | 1.08 | 3.5% |
| User 1 & 2 average (n=24) | 1.05 | |
| STDEV User 1 & 2 | 0.031 | |
| %CV inter User 1 & 2 | 2.9% |
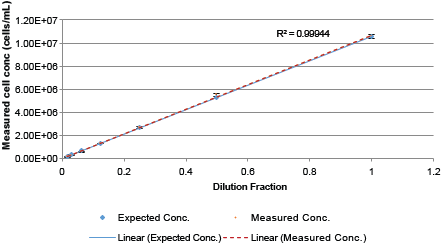
Cellometer Auto 2000 linearity
Following the guidelines published by NIST, linearity of the Auto 2000 was performed by measuring different Jurkat cell concentrations, plotted on a graph with expected cell concentrations compared with the measured cell concentrations. R2 value for the measure cell concentrations was >0.999 and the error bars overlaid with the expected cell concentration line.
Auto 2000 Serial dilution Jurkat cell concentrations
Error bars: +/- standard deviation for each average measured cell concentration
| Dilution | Expected Conc. | Measured Conc. | STDEV | %CV |
|---|---|---|---|---|
| 1 | 1.06E+07 | 1.06E+07 | 1.85E+05 | 1.8% |
| 0.5 | 5.29E+06 | 5.50E+06 | 9.25E+04 | 1.7% |
| 0.25 | 2.65E+06 | 2.69E+06 | 1.20E+05 | 4.5% |
| 0.125 | 1.32E+06 | 1.28E+06 | 2.74E+04 | 2.1% |
| 0.0625 | 6.61E+05 | 5.59E+05 | 3.78E+04 | 6.8% |
| 0.03125 | 3.31E+05 | 2.79E+05 | 2.68E+04 | 9.6% |
| 0.015625 | 1.65E+05 | 1.24E+05 | 1.21E+04 | 9.8% |


For research use only. Not for use in diagnostic procedures.